Daniel Willingham--Science & Education
Hypothesis non fingo
  • Home
  • About
  • Books
  • Articles
  • Op-eds
  • Videos
  • Learning Styles FAQ
  • Daniel Willingham: Science and Education Blog

Where does grade inflation come from?

2/20/2017

 
​​That college grades have risen over the last fifty years is not in dispute. The average course grade in college was 2.5 in 1960 (on a 4.0 grading scale) and had risen to 3.1 in 2006.

I often hear two reasons offered for the increase. During the 1960s, Professors ​were eager to help students stay in the school, so as to avoid the draft and the Vietnam war. (The lax standards were extended to female students for verisimilitude.)
Picture
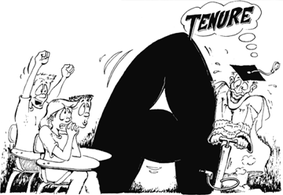
In more recent years, increases in grades are attributed to the consumer era of higher education. Students see college courses as a commodity they purchase, and professors, hoping for high enrollements and good course evaluations to boost their tenure prospects, hand out the A's.

This student-as-consumer account seems to be bolstered by the fact that grade inflation has been higher at private colleges and universities than at public ones. 

Both accounts propose that grade inflation is solely due to changes in professors' grading policies, and that students have not changed. A recent paper challenges that assumption, and offers some persuasive data. 

​Rey Hernández-Julián and Adam Looney brought economic models of inflation to bear on the question. As they point out, higher prices don't always signal inflation. For example, price may increase as quality increases. 

They examined 20 years of transcript data from 90,000 students at Clemson University over the years 1982-2001. During that time grades increased from 2.67 to 2.99, comparable to the increase observed elsewhere. They also had data on the characteristics of these students. 

The researchers observed shifts in student characteristics and course-taking behavior that accounted for a little more than half of the increase in grades.

First, the students coming to Clemson were better prepared, as measured by the SAT. Math scores increased by 29 points over the period, and Verbal scores by 15 points.

Second, student enrollment drifted towards departments that tend to assign higher grades. More students took courses in Speech and Communication, Spanish, Graphic Communications, and yes, Education; all these department assign average grades above the means of other departments. Tough-grading departments--Math, Accounting, Physics, Mechanical Engineering--saw drops in enrollment.

Third, the percentage of women at Clemson increased, and women earn higher grades than men do. This increase was modest (4% points) and accounts for little of the grade increase, but the authors point out that the increase in women enrollment is high nationwide (from 41% to 56% between 1970 and 2000) and so may account for more of the grade increase at other institutions. 

The upshot is that a little less than half of the increase in grades is attributable to grade inflation. The authors identify possible contributors to grade increase, and whatever they cannot account for is labeled "inflation." They point out that the actual value of grade inflation could be lower.

I would add that the actual value could, in theory, also be higher. Unobserved variables like course difficulty and student effort could be decreasing. Obviously measuring such variables at broad scale is difficult if not impossible. 

    Enter your email address:

    Delivered by FeedBurner

    RSS Feed


    Purpose

    The goal of this blog is to provide pointers to scientific findings that are applicable to education that I think ought to receive more attention.

    Archives

    April 2022
    July 2020
    May 2020
    March 2020
    February 2020
    December 2019
    October 2019
    April 2019
    March 2019
    January 2019
    October 2018
    September 2018
    August 2018
    June 2018
    March 2018
    February 2018
    November 2017
    October 2017
    September 2017
    August 2017
    July 2017
    June 2017
    April 2017
    March 2017
    February 2017
    November 2016
    September 2016
    August 2016
    July 2016
    June 2016
    May 2016
    April 2016
    December 2015
    July 2015
    April 2015
    March 2015
    January 2015
    September 2014
    August 2014
    July 2014
    June 2014
    May 2014
    April 2014
    March 2014
    February 2014
    January 2014
    December 2013
    November 2013
    October 2013
    September 2013
    August 2013
    July 2013
    June 2013
    May 2013
    April 2013
    March 2013
    February 2013
    January 2013
    December 2012
    November 2012
    October 2012
    September 2012
    August 2012
    July 2012
    June 2012
    May 2012
    April 2012
    March 2012
    February 2012

    Categories

    All
    21st Century Skills
    Academic Achievement
    Academic Achievement
    Achievement Gap
    Adhd
    Aera
    Animal Subjects
    Attention
    Book Review
    Charter Schools
    Child Development
    Classroom Time
    College
    Consciousness
    Curriculum
    Data Trustworthiness
    Education Schools
    Emotion
    Equality
    Exercise
    Expertise
    Forfun
    Gaming
    Gender
    Grades
    Higher Ed
    Homework
    Instructional Materials
    Intelligence
    International Comparisons
    Interventions
    Low Achievement
    Math
    Memory
    Meta Analysis
    Meta-analysis
    Metacognition
    Morality
    Motor Skill
    Multitasking
    Music
    Neuroscience
    Obituaries
    Parents
    Perception
    Phonological Awareness
    Plagiarism
    Politics
    Poverty
    Preschool
    Principals
    Prior Knowledge
    Problem-solving
    Reading
    Research
    Science
    Self-concept
    Self Control
    Self-control
    Sleep
    Socioeconomic Status
    Spatial Skills
    Standardized Tests
    Stereotypes
    Stress
    Teacher Evaluation
    Teaching
    Technology
    Value-added
    Vocabulary
    Working Memory