Daniel Willingham--Science & Education
Hypothesis non fingo
  • Home
  • About
  • Books
  • Articles
  • Op-eds
  • Videos
  • Learning Styles FAQ
  • Daniel Willingham: Science and Education Blog

What the PISA problem-solving scores mean--or don't.

4/24/2014

 
This blog posting first appeared on RealClearEducation on April 8, 2014.

The 2012 results for the brand-new PISA problem-solving test were released last week. News in various countries predictably focused on how well local students fared, whether they were American, British, Israeli, or Malaysian. The topic that should have been of greater interest  was what the test actually measures.

How do we know that a test measures what it purports to measure? There are a few ways to approach this problem.

One is when the content of the test seems, on the face of it, to represent what you’re trying to test. For example, math tests should require the solution of mathematical problems. History tests should require that test-takers display knowledge of history and the ability to use that knowledge as historians do. 

Things get trickier when you’re trying to measure a more abstract cognitive ability like intelligence. In contrast to math, where we can at least hope to specify what constitutes the body of knowledge and skills of the field, intelligence is not domain-specific. So we must devise other ways to validate the test. For example, we might say that people who score well on our test show their intelligence in other commonly accepted ways, like doing well in school and on the job.

Another strategy  is to define what the construct means—“here’s my definition of intelligence”—and then make a case for why your test items measure that construct as you’ve defined it.

So what approach does PISA take to problem-solving? It uses a combined strategy that ought to prompt serious reflection in education policymakers.

There is not any attempt to tie performance on the test to everyday measures of problem-solving. (At least, none have been offered so far, but there is more detail on the construction of the test to come, in an as-yet-unpublished technical report.)

From the scores report, it appears that the problem-solving test was motivated by a combination of the other two methods.

First, the OECD describes a conception of problem solving—what they think the mental processes look like. That includes the following processes:

·         Exploring and understanding

·         Representing and formulating

·         Planning and executing

·         Monitoring and reflecting

So we are to trust that the test measures problem solving ability because these are the constituent processes of problem solving, and we are to take it that the test authors could devise test items that tap these cognitive processes.

Now, this candidate taxonomy of processes that go into problem-solving seems reasonable at a glance, but I wouldn’t say that scientists are certain it’s right, or even that it’s the consensus best guess. Other researchers have suggested that different dimensions of problem solving are important—for example, well-defined problems vs. ill-defined problems. So pinning the validity of the PISA test on this particular taxonomy reflects a particular view of problem-solving.

But the OECD uses a second argument as well. They take an abstract cognitive process—problem solving—and vastly restrict its sweep by essentially saying “sure, it’s broad, but there is a limited way that we really care about how it’s implemented. So we just test those.”

That’s the strategy adopted by the National Adult Assessment of Literacy. Reading comprehension, like problem solving, is a cognitive process, and, like problem solving, it is intimately intertwined with domain knowledge. We’re better at reading about topics we already know something about. Likewise, we’re better at solving problems in domains we know something about. So in addition to (as best they could) requiring very little background knowledge for the test items, the designers of the NAAL wrote questions that they could argue reflect the kind reading people must do for basic citizenship. Things like reading a government-issued pamphlet about how to vote, and reading a bus schedule, and reading the instructions on prescription medicine.

The PISA problem solving test does something similar. They authors sought to present problems that students might really encounter, like figuring out how to work a new MP3 player, or finding the quickest route on a map, and or figuring out how to buy a subway ticket from an automated kiosk.

So with this justification, we don’t need to make a strong case that we really understand problem-solving at a psychological level at all. We just say “this is the kind of problem solving that people do, so we measured how well students do it.” 

This justification makes me nervous because the universe of possible activities we might agree represent “problem solving” seems so broad, much broader than what we would call activities for “citizenship reading.” A “problem” is usually defined as a situation in which you have a goal and you lack a ready process in memory that you’ve used before to solve the problem or one similar to it. That covers a lot of territory. So how do we know that the test fairly represents this territory?

The taxonomy is supposed to help with that problem. “Here’s the type of stuff that goes into problem solving, and look, we’ve got some problems for each type of stuff.” But I’ve already said that psychologists don’t have a firm enough grasp of problem-solving to advance a taxonomy with much confidence.

So the PISA 2012 is surely measuring something, and what it’s measuring is probably close to something I’d comfortably call “problem-solving.” But beyond that, I’m not sure what to say about it.

I probably shouldn’t get overwrought just yet—as I’ve mentioned, there is a technical report yet to come that will, I hope, leave all of us with a better idea of just what a score on this test means. Gaining that better idea will entail some hard work for education policymakers. The authors of the test have adopted a particular view of problem solving—that’s the taxonomy—and they have adopted a particular type of assessment—novel problems couched in everyday experiences. Education policymakers in each country must determine whether that view of problem solving syncs with theirs, and whether the type of assessment is suitable for their educational goals.

The way that people conceive of the other PISA subjects (math, science and reading) is almost surely more uniform than the way they conceive of problem-solving. Likewise, the goals for assessing those subjects is also more uniform. Thus, the problem of interpreting the problem-solving PISA scores is formidable compared to interpreting other scores. So no one should despair or rejoice over their country’s performance just yet.
Evaluating readability measures

4/9/2014

 
This piece first appeared on RealClearEducation.com on March 26.

How do you know that whether a book is at the right level of difficulty for a particular child? Or when thinking about learning standards for a state or district, how do we make a judgment about the text difficulty that, say, a sixth-grader ought to be able to handle?

It would seem obvious that an experienced teacher would use her judgment to make such decisions. But naturally such judgments will vary from individual to individual. Hence the apparent need for something more objective. Readability formulas are intended as just such a solution. You plug some characteristics of a text into a formula and it combines them into a number, a point on a reading difficulty scale. Sounds like an easy way to set grade-level standards and to pick appropriate texts for kids.

Of course, we’d like to know that the numbers generated are meaningful, that they really reflect “difficulty.”

Educators are often uneasy with readability formulas; the text characteristics are things like “words per sentence,” and “word frequency” (i.e., how many rare words are in the text). These seem far removed from the comprehension processes that would actually make a text more appropriate for third grade rather than fourth.

To put it another way, there’s more to reading than simple properties of words and sentences. There’s building meaning across sentences, and connecting meaning of whole paragraphs into arguments, and into themes. Readability formulas represent a gamble. The gamble is that the word- and sentence-level metrics will be highly correlated with the other, more important characteristics.

It’s not a crazy gamble, but a new study (Begeny & Greene, 2014) offers discouraging data to those who have been banking on it.

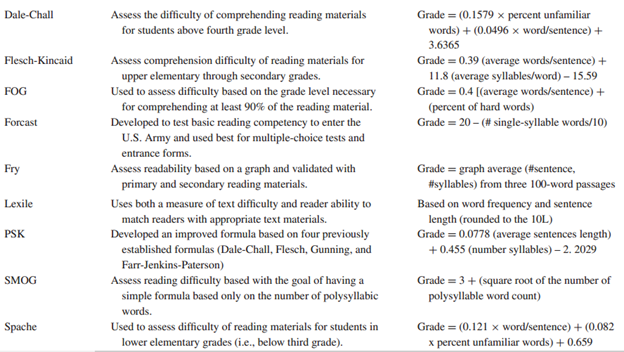
The authors evaluated 9 metrics, summarized in this table:

Picture
The dependent measure was student oral reading fluency, which boils down to number of words correctly read per minute. Oral fluency is sometimes used as a convenient proxy for overall reading skill. Although it obviously depends heavily on decoding fluency, there is also a contribution from higher-level meaning processing; if you are understanding what you’re reading, that primes expectations as you read, which makes reading more fluent.

In this experiment, second, third, fourth, and fifth graders each read six passages taken from the DIBELS test: two passages each from below, at, and above their grade level, for a total of six passages. 

Previous research has shown that the various readability formulas actually disagree about grade levels (e.g., Ardoin et al, 2005). In this experiment, oral reading fluency was to referee the disagreement. Suppose that according to PSK, passage A is appropriate for second graders and passage B is appropriate for third graders. Meanwhile Spache says both are third-grade passages. If oral reading fluency is better for passage A than passage B, that supports the PSK. (“Faster” was not evaluated only in absolute terms, but accounted for the standard error of the mean).

The researchers used an analytic scheme to evaluate how good a job each metric did of predicting the patterns of student oral reading fluency. Each prediction was considered binary: the grade level assignment predicted that there should be a difference (or not) in oral reading fluency: was a difference observed?  Chance, therefore, would be 50%. The data are summarized in the Table
Picture
All of the readability formulas were more accurate for higher ability than lower ability students. But only one—the Dale-Chall—was consistently above chance.

So (excepting the Dale-Chall), this study offers no evidence that standard readability formulas provide reliable information for teachers as they select appropriate texts for their students. As always, one study is not definitive, least of all for a broad and complex issue. This work ought to be replicated with other students, and with outcome measures other than fluency. Still, it contributes to what is, overall, a discouraging picture.

References

Ardoin, S. P., Suldo, S. M., Witt, J., Aldrich, S., & McDonald, E. (2005). Accuracy of readability estimates’ predictions of CBM performance. School Psychology Quarterly, 20, 1 – 22.

Begeny, J. C., & Greene, D. J. (2014). Can readability formuas be used to successfully gauge difficulty of reading materials? Psychology in the Schools, 51(2), 198-215.

You won't believe what Pearson has planned. No, really, you won't believe it.

11/25/2013

 
On a scale of 1 to 10, how much do you think Pearson publishing cares about the efficacy of their products?

Now now, I asked for a numerical rating, not invective or expletives.

My own rating might be a three or a four. I'm guessing that the folks at Pearson care about effectiveness to some extent because it affects how much things sell.

But the bottom line is that what matters is the bottom line. The success and failure of particular marketing strategies are followed closely, I'm guessing, as are sales of particular products. Learning outcomes from the product? Well, the customer can track them if they are interested.

So what are we to make of it when Pearson says "We are putting the pursuit of efficacy and learning outcomes at the centre of our new global education strategy."

Wut?

Educators have every right to be cynical. It's not just that Pearson has shown little inclination in this direction in the past, but also that it's a publicly traded company that shareholders ought to expect will put profits first.

Ironically, the path Pearson plans to effect this change is mostly about inputs: hiring people who care about efficacy, developing a global research network to gather evidence, that sort of thing.

But crucially they also promise to track outcomes, namely "to report audited learning outcomes, measures, and targets alongside its financial accounts, covering its whole business by 2018."

That's an enormous commitment and if they really follow through, it gives me some confidence that this is not merely a marketing ploy. Or if it is, the marketing team has concluded that to make this ploy appear not to be a ploy, they need to put some teeth in the plan.
PicturePsychometric headhunter?
A significant aspect of the success of this step turns on that small adjective "audited." It's not that hard to cook the learning outcome books. For this new effort to be persuasive, Pearson will need to have disinterested parties weigh in on the efficacy measures used, and their interpretation.


A person knowledgeable about testing, yet wholly disinterested? Does Pearson have Diogenes on staff?

There's another aspect of this plan that I find even more interesting, and potentially useful. Pearson has published a do-it-yourself efficacy review tool. It's a series of questions you are to consider to help you think about the effectiveness of a product you are currently using, or are contemplating using. There's an online version as well as a downloadable pdf.

The tool encourages you to consider four factors (listed here in my own phrasing):
  1. What am I trying to achieve?
  2. What evidence is there that this product will help with my goal?
  3. What's my plan to use this tool?
  4. Do I have what I need to make my plan work?

These simple, sensible questions are elaborated in the framework, but working through the details should still take less than an hour. The tool includes sample ratings to help the user think through the rating scheme.

I think this tool is great, and not just because it
aligns well with a similar tool I offered in When Can You Trust the Experts?

I think it offers Pearson a way to gain credibility as the company that cares about efficacy. If I were to hear that Pearson's sales force made a habit of encouraging district decision-makers to apply this efficacy framework to the educational products of Pearson (and others) that would be a huge step forward.

I would be even more impressed if Pearson warned users about the difficulty of overcoming the confirmation bias, and making these judgments objectively.

Still, this is a start. There might be some satisfaction in greeting this move with cynicism, but I think it's better to start with skepticism--skepticism that will prompt action and help to encourage educators to think effectively about efficacy. 

Self-control Gone Wild?

9/9/2013

 
The cover story of latest New Republic wonders whether American educators have fallen in blind love with self-control. Author Elizabeth Weil thinks we have. Titled “American Schools Are Failing Nonconformist Kids: In Defense of the Wild Child” the article suggests that educators harping on self-regulation are really trying to turn kids into submissive little robots. And they do so because little robots are easier to control in the classroom.

But lazy teachers are not the only cause. Education policy makers are also to blame, according to Weil. She writes that “valorizing self-regulation shifts the focus away from an impersonal, overtaxed, and underfunded school system and places the burden for overcoming those shortcomings on its students.”
Picture
And the consequence of educators’ selfishness? Weil tells stories that amount to Self-Regulation Gone Wild. A boy has trouble sitting cross-legged in class—the teacher opines he should be tested because something must be wrong with him. During story time the author’s daughter doesn’t like to sit still and to raise her hand when she wants to speak. The teacher suggests occupational therapy.

I can see why Weil and her husband were angry when their daughter’s teacher suggested occupational therapy simply because the child’s behavior was an inconvenience to him. But I don’t take that to mean that there is necessarily a widespread problem in the psyche of American teachers. I take that to mean that their daughter’s teacher was acting like a selfish bastard.

The problem with stories, of course, is that there are stories to support nearly anything. For every story a parent could tell about a teacher diagnosing typical behavior as a problem, a teacher could tell a story about a child who really could do with some therapeutic help, and whose parents were oblivious to that fact.

What about evidence beyond stories?

Weil cites a study by Duncan et al (2007) that analyzed six large data sets and found social-emotional skills were poor predictors of later success.

She also points out that creativity among American school kids dropped between 1984 and 2008 (as measured by the Torrance Test of Creative Thinking) and she notes “Not coincidentally, that decrease happened as schools were becoming obsessed with self-regulation.”

There is a problem here. Weil uses different terms interchangeably: self-regulation, grit, social-emotional skills. They are not same thing. Self-regulation (most simply put) is the ability to hold back an impulse when you think that that the impulse will not serve other interests. (The marshmallow study would fit here.) Grit refers to dedication to a long-term goal, one that might take years to achieve, like winning a spelling bee or learning to play the piano proficiently. Hence, you can have lots of self-regulation but not be very gritty. Social emotional skills might have self-regulation as a component, but it refers to a broader complex of skills in interacting with others.

These are not niggling academic distinctions. Weil is right that some research indicates a link between socioemotional skills and desirable outcomes, some doesn’t. But there is quite a lot of research showing associations between self-control and positive outcomes for kids including academic outcomes, getting along with peers, parents, and teachers, and the avoidance of bad teen outcomes (early unwanted pregnancy, problems with drugs and alcohol, et al.). I reviewed those studies here. There is another literature showing associations of grit with positive outcomes (e.g., Duckworth et al, 2007).

Of course, those positive outcomes may carry a cost. We may be getting better test scores (and fewer drug and alcohol problems) but losing kids’ personalities. Weil calls on the reader’s schema of a “wild child,” that is, an irrepressible imp who may sometimes be exasperating, but whose very lack of self-regulation is the source of her creativity and personality.

Picture
But irrepressibility and exuberance is not perfectly inversely correlated with self-regulation. The purpose of self-regulation is not to lose your exuberance. It’s to recognize that sometimes it’s not in your own best interests to be exuberant. It’s adorable when your six year old is at a family picnic and impulsively practices her pas de chat because she cannot resist the Call of the Dance. It’s less adorable when it happens in class when everyone else is trying to listen to a story.

So there’s a case to be made that American society is going too far in emphasizing self-regulation. But the way to make it is not to suggest that the natural consequence of this emphasis is the crushing of children’s spirits because self-regulation is the same thing as no exuberance. The way to make the case is to show us that we’re overdoing self-regulation. Kids feel burdened, anxious, worried about their behavior.

Weil doesn’t have data that would bear on this point. I don’t either. But my perspective definitely differs from hers. When I visit classrooms or wander the aisles of Target, I do not feel that American kids are over-burdened by self-regulation.

As for the decline in creativity from 1984 and 2008 being linked to an increased focus on self-regulation…I have to disagree with Weil’s suggestion that it’s not a coincidence (setting aside the adequacy of the creativity measure). I think it might very well be a coincidence. Note that scores on the mathematics portion of the long-term NAEP increased during the same period. Why not suggest that kids improvement in a rigid, formulaic understanding of math inhibited their creativity?

Can we talk about important education issues without hyperbole? 

References

Duckworth, A. L., Peterson, C., Matthews, M. D., & Kelly, D. R. (2007). Grit: perseverance and passion for long-term goals. Journal of personality and social psychology, 92(6), 1087.

Duncan, G. J., Dowsett, C. J., Claessens, A., Magnuson, K., Huston, A. C., Klebanov, P., ... & Japel, C. (2007). School readiness and later achievement. Developmental psychology, 43(6), 1428.

How to make edu-blogging less boring

7/30/2013

 
I read a lot of blogs. I only comment when I think I have something to add (which is rare, even on my own blog) but I read a lot of them.

Today, I offer a plea and a suggestion for making education blogs less boring, specifically on the subject of standardized testing.

I begin with two Propositions about human behavior
  • Proposition 1: If you provide incentives for X, people are more likely to do what they think will help them get X. They may even attempt to get X through means that are counterproductive.
  • Proposition 2: If we use procedure Z to change Y in order to make it more like Y’, we need to measure Y in order to know whether procedure Z is working. We have to be able to differentiate Y and Y’.

A lot of blog posts on the subject of testing are boring because authors pretend that one of these propositions is false or irrelevant.

On Proposition 1: Standardized tests typically gain validity by showing that scores are associated with some outcome you care about. You seldom care about the items on the test specifically. You care about what they signify. Sometimes tests have face validity, meaning test items look like they test what they are meant to test—a purported history test asks questions about history, for example. Often they don’t, but the test is still valid. A well-constructed vocabulary test can give you a pretty good idea of someone’s IQ, for example.

Just as body temperature is a reliable, partial indicator of certain types of disease, a test score is a reliable, partial indicator of certain types of school outcomes. But in most circumstances your primary goal is not a normal body temperature; it’s that the body is healthy, in which case body temperature will be normal as a natural consequence of the healthy state.
Picture
Bloggers ignoring basic propositions about human behavior? What's up with that?
If you attach stakes to the outcome, you can’t be surprised if some people treat the test as something different than that. They focus on getting body temperature to 98.6, whatever the health of the patient. That’s Proposition 1 at work. If a school board lets an administrator know that test scores had better go up or she can start looking for another job. . . well, what would you do in those circumstances? So you get test-prep frenzy. These are social consequences of tests, as typically used.

On Proposition 2: Some form of assessment is necessary. Without it, you have no idea how things are going. You won’t find many defenders of No Child Left Behind, but one thing we should remember is that the required testing did expose a number of schools—mostly ones serving disadvantaged children—where students were performing very poorly. And assessments have to be meaningful, i.e., reliable and valid. Portfolio assessments, for example, sound nice, but there are terrible problems with reliability and validity. It’s very difficult to get them to do what they are meant to do.

So here’s my plea. Admit that both Proposition 1 and Proposition 2 are true, and apply to testing children in schools.

People who are angry about the unintended social consequences of standardized testing have a legitimate point. They are not all apologists for lazy teachers or advocates of the status quo. Calling for high-stakes testing while taking no account of these social consequences, offering no solution to the problem . . . that's boring.

People who insist on standardized assessments have a legitimate point. They are not all corporate stooges and teacher-haters. Deriding “bubble sheet” testing while offering no viable alternative method of assessment . . . that's boring.

Naturally, the real goal is not to entertain me with more interesting blog posts. The goal is to move the conversation forward. The landscape will likely change consequentially in the next two years. This is the time to have substantive conversations.

What predicts college GPA?

2/18/2013

 
What aspects of background, personality, or achievement predict success in college--at least, "success" as measured by GPA?

A recent meta-analysis (Richardson, Abraham, & Bond, 2012) gathered articles published between 1997 and 2010, the products of 241 data sets. These articles had investigated these categories of predictors:
  • three demographic factors (age, sex, socio-economic status)
  • five traditional measures of cognitive ability or prior academic achievement (intelligence measures, high school GPA, SAT or ACT, A level points)
  • No fewer than forty-two non-intellectual measures of personality, motivation, or the like, summarized into the categories shown in the figure below (click for larger image).
Picture
Make this fun. Try to predict which of the factors correlate with college GPA.

Let's start with simple correlations.

41 out of the 50 variables examined showed statistically significant correlations. But statistical significance is a product of the magnitude of the effect AND the size of the sample--and the samples are so big that relatively puny effects end up being statistically significant. So in what follows I'll mention correlations of .20 or greater.

Among the demographic factors, none of the three were strong predictors. It seems odd that socio-economic status would not be important, but bear in mind that we are talking about college students, so this is a pretty select group, and SES likely played a significant role in that selection. Most low-income kids didn't make it, and those who did likely have a lot of other strengths.

The best class of predictors (by far) are the traditional correlates, all of which correlate at least r = .20 (intelligence measures) up to r = .40 (high school GPA; ACT scores were also correlated r = .40).

Personality traits were mostly a bust, with the exception of consientiousness (r = .19), need for cognition (r = .19), and tendency to procrastinate (r = -.22). (Procrastination has a pretty tight inverse relationship to conscientiousness, so it strikes me as a little odd to include it.)

Motivation measures were also mostly a bust but there were strong correlations with academic self-efficacy (r = .31) and performance self-efficacy (r = .59). You should note, however, that the former is pretty much like asking students "are you good at school?" and the latter is like asking "what kind of grades do you usually get?" Somewhat more interesting is "grade goal" (r = .35) which measures whether the student is in the habit of setting a specific goal for test scores and course grades, based on prior feedback.

Self-regulatory learning strategies likewise showed only a few factors that provided reliable predictors, including time/study management (r = .22) and effort regulation (r = .32), a measure of persistence in the face of academic challenges.

Not much happened in the Approach to learning category nor in psychosocial contextual influences.

We would, of course, expect that many of these variables would themselves be correlated, and that's the case, as shown in this matrix.
Picture
So the really interesting analyses are regressions that try to sort out which matter more.

The researchers first conducted five hierarchical linear regressions, in each case beginning with SAT/ACT, then adding high school GPA, and then investigating whether each of the five non-intellective predictors would add some predictive power. The variables were conscientiousness, effort regulation, test anxiety, academic self efficacy, and grade goal, and each did, indeed, add power in predicting college GPA after "the usual suspects" (SAT or ACT, and high school GPA) were included.

But what happens when you include all the non-intellective factors in the model?

The order in which they are entered matters, of course, and the researchers offer a reasonable rationale for their choice; they start with the most global characteristic (conscientiousness) and work towards the more proximal contributors to grades (effort regulation, then test anxiety, then academic self-efficacy, then grade goal).

As they ran the model, SAT and high school GPA continued to be important predictors. So were effort regulation and grade goal.

You can usually quibble about the order in which variables were entered and the rationale for that ordering, and that's the case here.  As they put the data together, the most important predictors of college grade point average are: your grades in high school, your score on the SAT or ACT, the extent to which you plan for and target specific grades, and your ability to persist in challenging academic situations.

There is not much support here for the idea that demographic or psychosocial contextual variables matter much. Broad personality traits, most motivation factors, and learning strategies matter less than I would have guessed.

No single analysis of this sort will be definitive. But aside from that caveat, it's important to note that most admissions officers would not want to use this study as a one-to-one guide for admissions decisions. Colleges are motivated to admit students who can do the work, certainly. But beyond that they have goals for the student body on other dimensions: diversity of skill in non-academic pursuits, or creativity, for example.

When I was a graduate student at Harvard, an admissions officer mentioned in passing that, if Harvard wanted to, the college could fill the freshman class with students who had perfect scores on the SAT. Every single freshman-- 800, 800. But that, he said, was not the sort of freshman class Harvard wanted.

I nodded as though I knew exactly what he meant. I wish I had pressed him for more information.

References:
Richardson, M., Abraham, C., Bond, R. (2012). Psychological correlates of university students' academic performance: A systematic review and meta-analysis. Psychological Bulletin, 138,  353-387.


The PIRLS Reading Result--Better than You May Realize

12/17/2012

 
The PIRLS results are better than you may realize.

Last week, the results of the 2011 Progress in International Reading Literacy Study (PIRLS) were published. This test compared reading ability in 4th grade children.

U.S. fourth-graders ranked 6th among 45 participating countries. Even better, US kids scored significantly better than the last time the test was administered in 2006.

There's a small but decisive factor that is often forgotten in these discussions: differences in orthography across languages.
Picture
Lots of factors go into learning to read. The most obvious is learning to decode--learning the relationship between letters and (in most languages) sounds. Decode is an apt term. The correspondence of letters and sound is a code that must be cracked.

In some languages the correspondence is relatively straightforward, meaning that a given letter or combination of letters reliably corresponds to a given sound. Such languages are said to have a shallow orthography. Examples include Finnish, Italian, and Spanish.

In other languages, the correspondence is less consistent. English is one such language. Consider the letter sequence "ough." How should that be pronounced? It depends on whether it's part of the word "cough," "through," "although," or "plough." In these languages, there are more multi-letter sound units, more context-depenent rules and more out and out quirks.

Another factor is syllabic structure. Syllables in languages with simple structures typically (or exclusively) have the form CV (i.e., a consonant, then a vowel as in "ba") or VC (as in "ab.") Slightly more complex forms include CVC ("bat") and CCV ("pla"). As the number of permissible combinations of vowels and consonants that may form a single syllable increases, so does the complexity. In English, it's not uncommon to see forms like CCCVCC (.e.g., "splint.")

Here's a figure (Seymour et al., 2003) showing the relative orthographic depth of 13 languages, as well as the complexity of their syllabic structure.

Picture
From Seymour et al (2003)
Orthographic depth correlates with incidence of dyslexia (e.g., Wolf et al, 1994) and with word and nonword reading in typically developing children (Seymour et al. 2003). Syllabic complexity correlates with word decoding (Seymour et al, 2003).

This highlights two points, in my mind.

First, when people trumpet the fact that Finland doesn't begin reading instruction until age 7 we should bear in mind that the task confronting Finnish children is easier than that confronting English-speaking children. The late start might be just fine for Finnish children; it's not obvious it would work well for English-speakers.

Of course, a shallow orthography doesn't guarantee excellent reading performance, at least as measured by the PIRLS. Children in Greece, Italy, and Spain had mediocre scores, on average. Good instruction is obviously still important.

But good instruction is more difficult in languages with deep orthography, and that's the second point. The conclusion from the PIRLS should not just be "Early elementary teachers in the US are doing a good job with reading." It should be "Early elementary teachers in the US are doing a good job with reading despite teaching reading in a language that is difficult to learn."


References

Seymour, P. H. K., Aro, M., & Erskine, J. M. (2003). Foundation literacy acquisition in European orthographies. British Journal of Psychology, 94, 143-174.

Wolf, M., Pfeil, C., Lotz, R., & Biddle, K. (1994). Towarsd a more universal understanding of the developmental dyslexias: The contribution of orthographic factors. In Berninger, V. W. (Ed), The varieties of orthographic knowledge, 1: Theoretical and developmental issues.Neuropsychology and cognition, Vol. 8., (pp. 137-171). New York, NY, US: Kluwer

Did Michael Gove Get the Science Right?

11/19/2012

 
Michael Gove, Secretary of State for Education in Great Britain, delivered a speech on education policy last week called "In Praise of Tests" (text here),  in which he argued for "regular, demanding, rigourous examinations."

The reasons offered included arguments invoking scientific evidence, and cited my work as examples of such evidence. That invites the question "Does Willingham think that the scientific evidence supports testing, as Gove suggested?"

This question really has two parts. Did Gove get the science right? And did he apply it in a way that is likely to work as he expects?

The answer to the first question is straightforward: yes, he got the science right. The answer to the second question is that I agree that testing is necessary, but have a different take on the scientific backing for this claim than Gove offered.

First, the science. Gove made three scientific claims. First, that people enjoy mental activity that is successful--it's fun to solve challenging problems. Much of the first chapter of Why Don't Students Like School is devoted to this idea, but it's a commonplace observation; that's why people enjoy problem-solving hobbies like crossword puzzles or reading mystery novels.

Second, Gove claimed that background knowledge is critical for higher thought, a topic I've written about in several places (e.g., here).

The only quibble I have with Gove on this topic is when he says "Memorisation is a necessary precondition of understanding." I'd have preferred "knowledge," to "memorisation" because the latter makes it sound as though one must sit down and willfully commit information to memory. This is a poor way to learn new information--it's much more desirable that the to-be-learned material is embedded in some interesting activity, so that the student will be likely to remember it as a matter of course.

It's plain that Gove agrees with me on this point, because he emphasized that exam preparation should not mean a dull drilling of facts, but rather should happen through "entertaining narratives in history, striking practical work in science and unveiling hidden patterns in maths." I think the word "memorisation" may be what led the Guardian to use a headline suggesting Gove was advocating rote learning.

Third, Gove argued that people (teachers and others) are biased in their evaluations of students, based on the student's race, ethnicity, gender, or other features that have nothing to do with the students actual performance. A number of studies from the last forty years show that this danger is real.

So on the science, I think Gove is on firm ground. What of the policy he's advocating?

I lack expertise in policy matters, and I've argued on this blog that the world  of education might be less chaotic if each of us stuck a little closer to the home territory of what we know. Worse yet, I know little about the British education system nor about Gove's larger policy plans. With those caveats in place, I'll tread on Gove's territory and offer these thoughts on policy.

It's true that successful thought brings pleasure. The sort of effort I (and others) meant was the solving of a cognitive problem. Gove offers the example of a singer finishing an aria or a craftsman finishing an artefact. These works of creative productivity likely would bring the sort of pleasure I discussed. It's less certain that the passing of examination would be "successful thought" in this sense.

Why? Because exams seldom call for the creative deployment of knowledge. Instead, they call for the straightforward recall of knowledge. That's because it's very difficult to write exams that call for creative responses, yet are psychometrically reliable and valid.

There is a second manner in which achievement can bring pleasure; I haven't written about it, but I think it's the one Gove may have in mind. It's the pleasure of overcoming a formidable obstacle that you were not sure you could surmount.

I agree that passing a difficult test could be a profound experience. Some children really don't see themselves as students. They have self-confidence, but it comes from knowing that they are effective in other activities. Passing a challenging exam might prompt child who never really thought of himself as "a student" to recognize that he's every bit as able as other children, and that might redirect the remainder of his school experience, even his life.

But there are some obvious difficulties in reaching this goal. How do we motivate the student to work hard enough to actually pass the difficult test? The challenge of the exam is unlikely to do it--the child is much more likely to conclude that he can't possibly pass, so there is no point in trying.

The clear solution is to engage creative teachers who have the skill to work with students who begin school poorly prepared and who may come from homes where education is not a priority. But motivation was the problem we began with, the one we hoped to address. It seems to me that the motivational boost we get from kids passing a tough exam might be a good outcome of successfully motivating kids. It's not clear to me that it will motivate them.

My second concern in Gove's vision of testing is how teachers will believe they should best prepare kids for a difficult exam that demands a lot of factual recall.

Gove is exactly right when he argues that teachers ought not to construe this as a call for rote learning of lists of facts, but rather should ensure that rich factual content is embedded in rich learning activities.

My concern is that some British teachers--in particular, the ones whose performance Gove hopes to boost--won't listen to him.

I say that because of the experience in the US with the No Child Left Behind Act. In the face of mandatory testing for students, some teachers kept doing what they had been doing, which is exactly what Gove suggests; rich content interwoven with a demand for critical thinking, delivered in a way that motivates kids. These teachers were unfazed by the test, certain that their students would pass.

Other teachers changed lesson plans to emphasize factual knowledge, and focused activities on test prep. I've never met a teacher who was happy about this change. Teachers emphasize facts at the expense of all else and engage in disheartening test prep because they think it's necessary.

Teachers believed it was necessary because (1) they were uncertain that their old lesson plans would leave kids with the factual knowledge base to pass the test; or (2) they thought that their students entered the class so far behind that extreme measures were necessary to get them to the point of passing; or (3) they thought that the test was narrow or poorly designed and would not capture the learning that their old set of lesson plans brought to kids; or (4) some combination of these factors. So pointing out that exam prep and memorization of facts is bad practice will probably not be enough.

Despite these difficulties, I think some plan of testing is necessary.  Gove puts it this way: "Exams help those who need support to better know what support they need." A cognitive psychologist would say "learning is not possible without feedback." That learning might be an individual student mastering a subject, OR a teacher evaluating whether his students learned more from a new set of lesson plans he devised compared to last year, OR whether students at a school are learning more with block scheduling compared to their old schedule. In each case, you want to be confident that the feedback is valid, reliable, and unbiased. And if social psychology has taught us anything in the last fifty years, it's that people will believe their informal judgments are valid, reliable, and unbiased, whether they are or not.

There's more to the speech and I encourage you to read all of it. Here I've commented only on some of the centerpiece scientific claims in it. Again, I emphasize that I don't know British education and I don't know Gove's plans in their entirety, so what I've written here may be inaccurate because it lacks broader context.

I can confidently say this: hard as it is, good science is easier than good policy. 


How to abuse standarized tests

4/9/2012

 
The insidious thing about tests is that they seem so straightforward. I write a bunch of questions. My students try to answer them. And so I find out who knows more and who knows less.

But if you have even a minimal knowledge of the field of psychometrics, you know that things are not so simple.

And if you lack that minimal knowledge, Howard Wainer would like a word with you.

Picture
Wainer is a psychometrician who spent many years at the Educational Testing Service and now works at the National Board of Medical Examiners. He describes himself as the kind of guy who shouts back at the television when he sees something to do with standardized testing that he regards as foolish. These one-way shouting matches occur with some regularity, and Wainer decided to record his thoughts more formally.

The result is an accessible book, Uneducated Guesses, explaining the source of his ire on 10 current topics in testing. They make for an interesting read for anyone with even minimal interest in the topic.

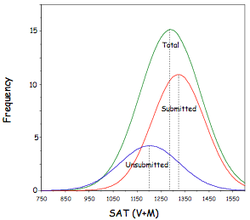
For example, consider the making of a standardized test like the SAT or ACT optional for college applicants, a practice that seems egalitarian and surely harmless. Officials at Bowdoin College have made the SAT optional since 1969. Wainer points out the drawback--useful information about the likelihood that students will succeed at Bowdoin is omitted.

Here's the analysis. Students who didn't submit SAT scores with their application nevertheless took the test. They just didn't submit their scores. Wainer finds that, not surprisingly, students who chose not to submit their scores did worse than those who did, by about 120 points.

Picture
Figure taken from Wainer's blog.

Wainer also finds that those who didn't submit their scores had worse GPAs in their freshman year, and by about the amount that one would predict, based on the lower scores.

So although one might reject the use of a standardized admissions tests out of some conviction, if the job of admissions officers at Bowdoin is to predict how students will fare there, they are leaving useful information on the table.

The practice does bring a different sort of advantage to Bowdoin, however. The apparent average SAT score of their students increases, and average SAT score is one factor in the quality rankings offered by US News and World Report.

In another fascinating chapter, Wainer offers a for-dummies guide to equating tests. In a nutshell, the problem is that one sometimes wants to compare scores on tests that use different items—for example, different versions of the SAT. As Wainer points out, if the tests have some identical items, you can use performance on those items as “anchors” for the comparison. Even so, the solution is not straightforward, and Wainer deftly takes the reader through some of the issues.

But what if there is very little overlap on the tests?

Wainer offers this analogy. In 1998, the Princeton High School football team was undefeated. In the same year, the Philadelphia Eagles won just three games. If we imagine each as a test-taker, the high school team got a perfect score, whereas the Eagles got just three items right. But the “tests” each faced contained very different questions and so they are not  comparable. If the two teams competed, there's not much doubt as to who would win.

The problem seems obvious when spelled out, yet one often hears calls for uses of tests that would entail such comparisons—for example, comparing how much kids learn in college, given that some major in music, some in civil engineering, and some in French.

And yes, the problem is the same when one contemplates comparing student learning in a high school science class and a high school English class as a way of evaluating their teachers. Wainer devotes a chapter to value-added measures. I won't go through his argument, but will merely telegraph it: he's not a fan.

In all, Uneducated Guesses is a fun read for policy wonks. The issues Wainer takes on are technical and controversial—they represent the intersection of an abstruse field of study and public policy. For that reason, the book can't be read as a definitive guide. But as a thoughtful starting point, the book is rare in its clarity and wisdom.

Early elementary education includes almost no science

3/2/2012

 
I want to highlight two incredibly valuable papers, although they are increasingly dated.

One paper reports on an enormous project in which observers went into a large sample of US first grade classrooms (827 of them in 295 districts) and simply recorded what was happening. The other paper reported on a comparable project for third grade classrooms (780 students in 250 districts)

Both papers are a treasure trove of information, but I want to highlight one striking datum: the percentage of time spent on science.

In first grade classrooms it was 4%.
In third grade classrooms it was 5%.

There are a few oddities that might make you wonder about these figures. In the 1st grade paper, the observations typically took place in the morning, so perhaps teachers tend to focus on ELA in the morning and save science for the afternoon. But the third grade project sampled throughout the day.

And although there's always some chance that there's something odd about the method, the estimates accord with estimates using other measures, such as teachers' estimates. (See data from an NSF project here.)

And before you blame NCLB for crowding science out of the classroom, note that the data for these studies were collected before NCLB. (1st grade, mostly '97-98; 3rd grade, mostly '00-'01). I don't think there's much reason to suspect that the time spent on science instruction has increased, and smaller scale studies indicate it hasn't.

The fact that so little time is spent on science is, to me, shocking.

It's even more surprising when paired with the observation that US kids fare pretty well in international comparisons of science achievement.

In 2003, when more or less the same cohort of kids took the TIMMS US kids ranked 6th in science. (They ranked 5th in 2008.)

How are US kids doing fairly well in science in the absence of science instruction?

Possibly US schools are terribly efficient in science instruction and get a lot done in minimum time. Possibly other countries are doing even less. Possibly US culture offers good support for informal opportunities to learn science.

It remains a puzzle.

There is a lot of talk about STEM instruction these days. In most districts, science doesn't get serious until middle school. US schools could be doing a whole lot more with more time devoted to science instruction.

I'll have more to say about time in elementary classrooms next week.

NICHD Early Child Care Research Network (2002). The relation of global first-grade classroom environment to structural classroom features and teacher and student behaviors. The Elementary School Journal, 102, 367-387.

NICHD Early Child Care Research Network (2005). A day in third grade: A large-scale study of classroom quality and teacher and student behavior.
The Elementary School Journal, 105, 305-323.
<<Previous

    Enter your email address:

    Delivered by FeedBurner

    RSS Feed


    Purpose

    The goal of this blog is to provide pointers to scientific findings that are applicable to education that I think ought to receive more attention.

    Archives

    April 2022
    July 2020
    May 2020
    March 2020
    February 2020
    December 2019
    October 2019
    April 2019
    March 2019
    January 2019
    October 2018
    September 2018
    August 2018
    June 2018
    March 2018
    February 2018
    November 2017
    October 2017
    September 2017
    August 2017
    July 2017
    June 2017
    April 2017
    March 2017
    February 2017
    November 2016
    September 2016
    August 2016
    July 2016
    June 2016
    May 2016
    April 2016
    December 2015
    July 2015
    April 2015
    March 2015
    January 2015
    September 2014
    August 2014
    July 2014
    June 2014
    May 2014
    April 2014
    March 2014
    February 2014
    January 2014
    December 2013
    November 2013
    October 2013
    September 2013
    August 2013
    July 2013
    June 2013
    May 2013
    April 2013
    March 2013
    February 2013
    January 2013
    December 2012
    November 2012
    October 2012
    September 2012
    August 2012
    July 2012
    June 2012
    May 2012
    April 2012
    March 2012
    February 2012

    Categories

    All
    21st Century Skills
    Academic Achievement
    Academic Achievement
    Achievement Gap
    Adhd
    Aera
    Animal Subjects
    Attention
    Book Review
    Charter Schools
    Child Development
    Classroom Time
    College
    Consciousness
    Curriculum
    Data Trustworthiness
    Education Schools
    Emotion
    Equality
    Exercise
    Expertise
    Forfun
    Gaming
    Gender
    Grades
    Higher Ed
    Homework
    Instructional Materials
    Intelligence
    International Comparisons
    Interventions
    Low Achievement
    Math
    Memory
    Meta Analysis
    Meta-analysis
    Metacognition
    Morality
    Motor Skill
    Multitasking
    Music
    Neuroscience
    Obituaries
    Parents
    Perception
    Phonological Awareness
    Plagiarism
    Politics
    Poverty
    Preschool
    Principals
    Prior Knowledge
    Problem-solving
    Reading
    Research
    Science
    Self-concept
    Self Control
    Self-control
    Sleep
    Socioeconomic Status
    Spatial Skills
    Standardized Tests
    Stereotypes
    Stress
    Teacher Evaluation
    Teaching
    Technology
    Value-added
    Vocabulary
    Working Memory